
Plotting / Printing Pipe and Valves in an Irrigation Design
Updated on: March 31, 2022
Quick video

- The Color-Code Sized Pipe Option & Plotting
- Plotting Pipe
- Plotting Pipe Sizes in Color
- Plot Valves in Color to Show Their Sizes
- CTB Plotting Styles
Because all the lateral and mainline pipes in your irrigation system design consist of different linetypes with their own assigned colors and lineweights, plotting pipe can seem challenging at times. However, at its core, it's a simple concept.
Find out how to change the line colors for your pipes and other items to match your office standards. See our Land F/X line colors and block color instructions.
The Colorize Sized Pipe Option & Plotting
Our Irrigation Preferences screen includes a Color-code sized pipe option, which can come in extremely handy for differentiating between the different pipe sizes in your drawing.
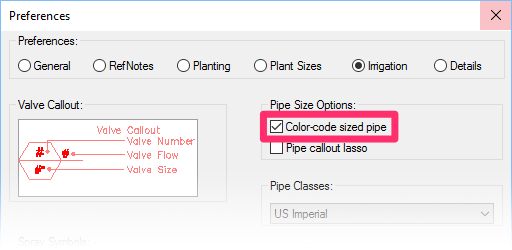

With the Color-code sized pipe option checked, the lateral pipes as viewed in your drawing will be assigned with colors that we've pre-associated with each size, as pictured to the left.
With the Color-code sized pipe option unchecked, the lateral pipes as viewed in your drawing will all be assigned the same color, as pictured to the right. (This color will vary depending on your settings.)


Whether or not this option is checked, the lateral pipe will all still show up in black when you plot, as pictured to the left.
Unfortunately, many users feel the need to uncheck this option simply because they're not seeing the results they want when they plot. When this option is unchecked, you lose the visual help of seeing the color change between pipe sizes – all for the marginal simplicity of only working with a single color. Keep reading to find out how to keep your pipes color-coded in your drawings while still plotting correctly!
Plotting Pipe
In terms of plotting, lateral and mainline pipes are just polylines. As a result, they're incredibly easy to configure and make them look exactly how you want them to look.
As you can with any linetype created with our software, you can easily change the colors and lineweights of your pipes. The easiest way to reference the pipe linetypes is to download our LFX Pens document, which lists all linetypes and colors you'll use when designing with our software. Download it here:
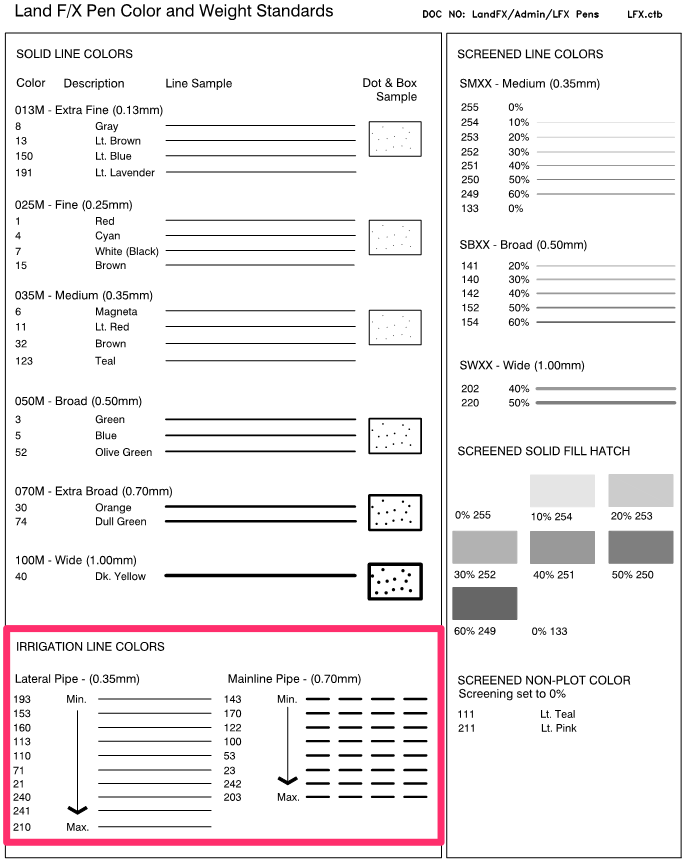
The image to the left shows what the Pens document looks like when plotted.
The line colors used for irrigation (that is, all the lateral and mainline pipe linetypes) are grouped at the bottom left.
Note that these pipe colors just apply from the minimum size to the largest size. All pipe larger than the last color shown in the Pens document will receive the same color as the previously largest size by default. You can change these colors to meet your needs (see below).
To configure the colors of these lines to your standards, follow our steps to change our line colors for each of these lines you want to change. It's that simple!
To change the settings for one of the piping linetypes, open the General Preferences and click the Block Colors button.
Select the line color you want to edit in the Block Layers Colors dialog box. We'll edit line color 193, which is one of the line colors assigned to lateral pipe.
Click Edit to begin make your edits.


In the Edit Block Layer dialog box, you can make the necessary changes to the selected line color, as pictured to the left.
Use the top menu to change the selected line's color, and use the bottom menu to change its plot width.
You can also add notes in the text field at the bottom.
Plotting Pipe Sizes in Color
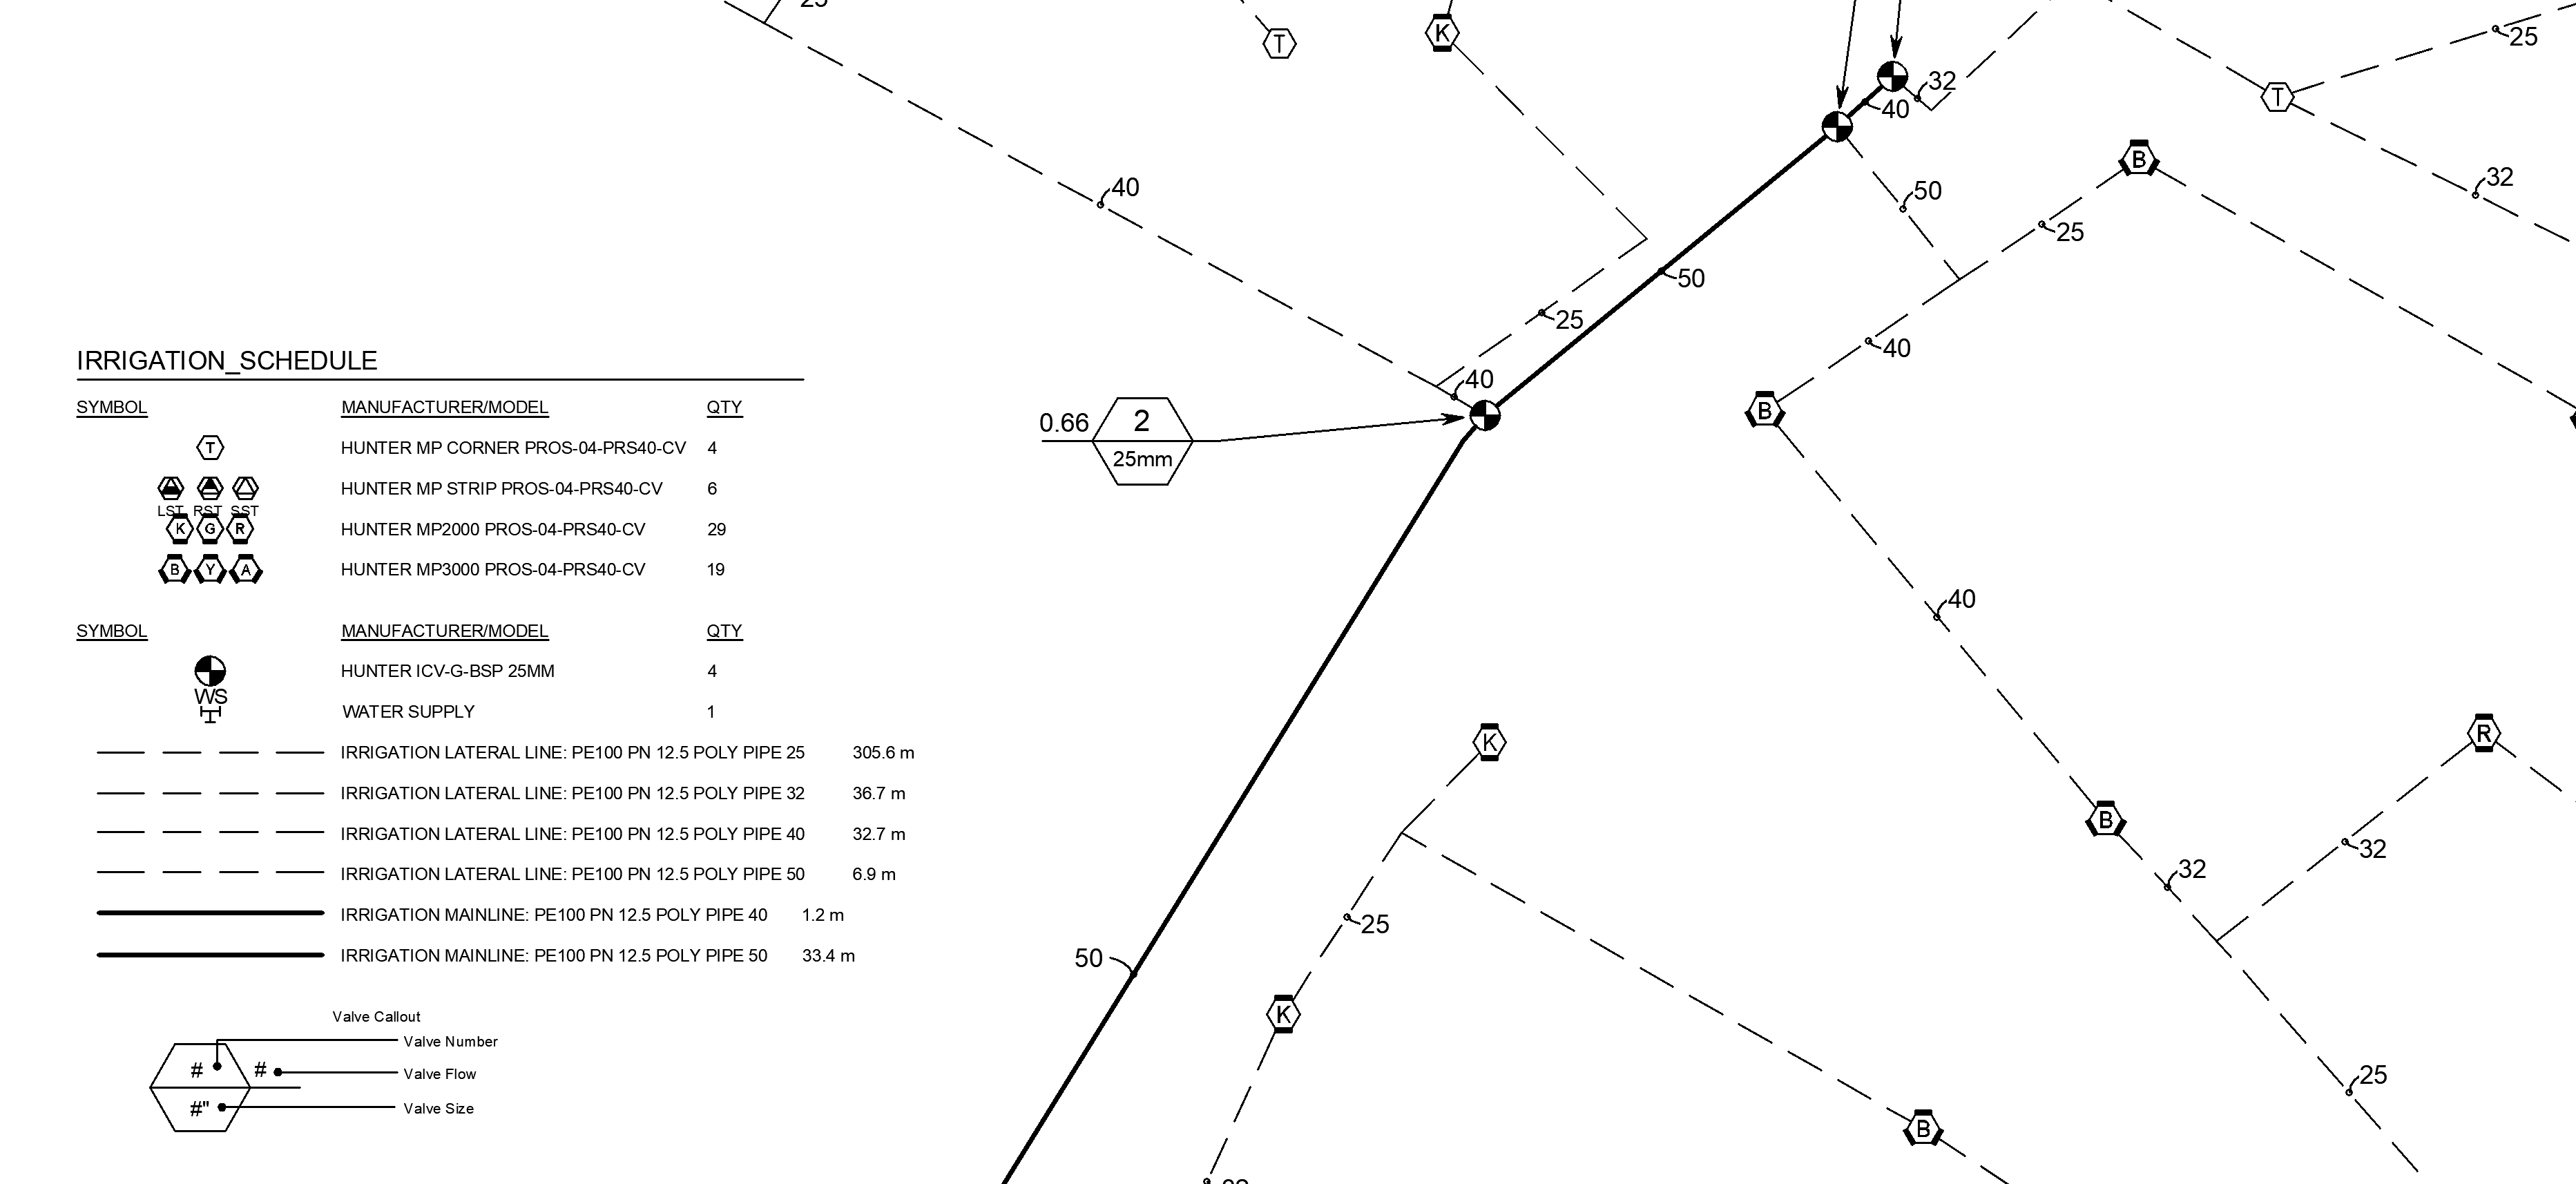
The default Land F/X plot styles plot linework, including pipes, in black & white, as pictured below.
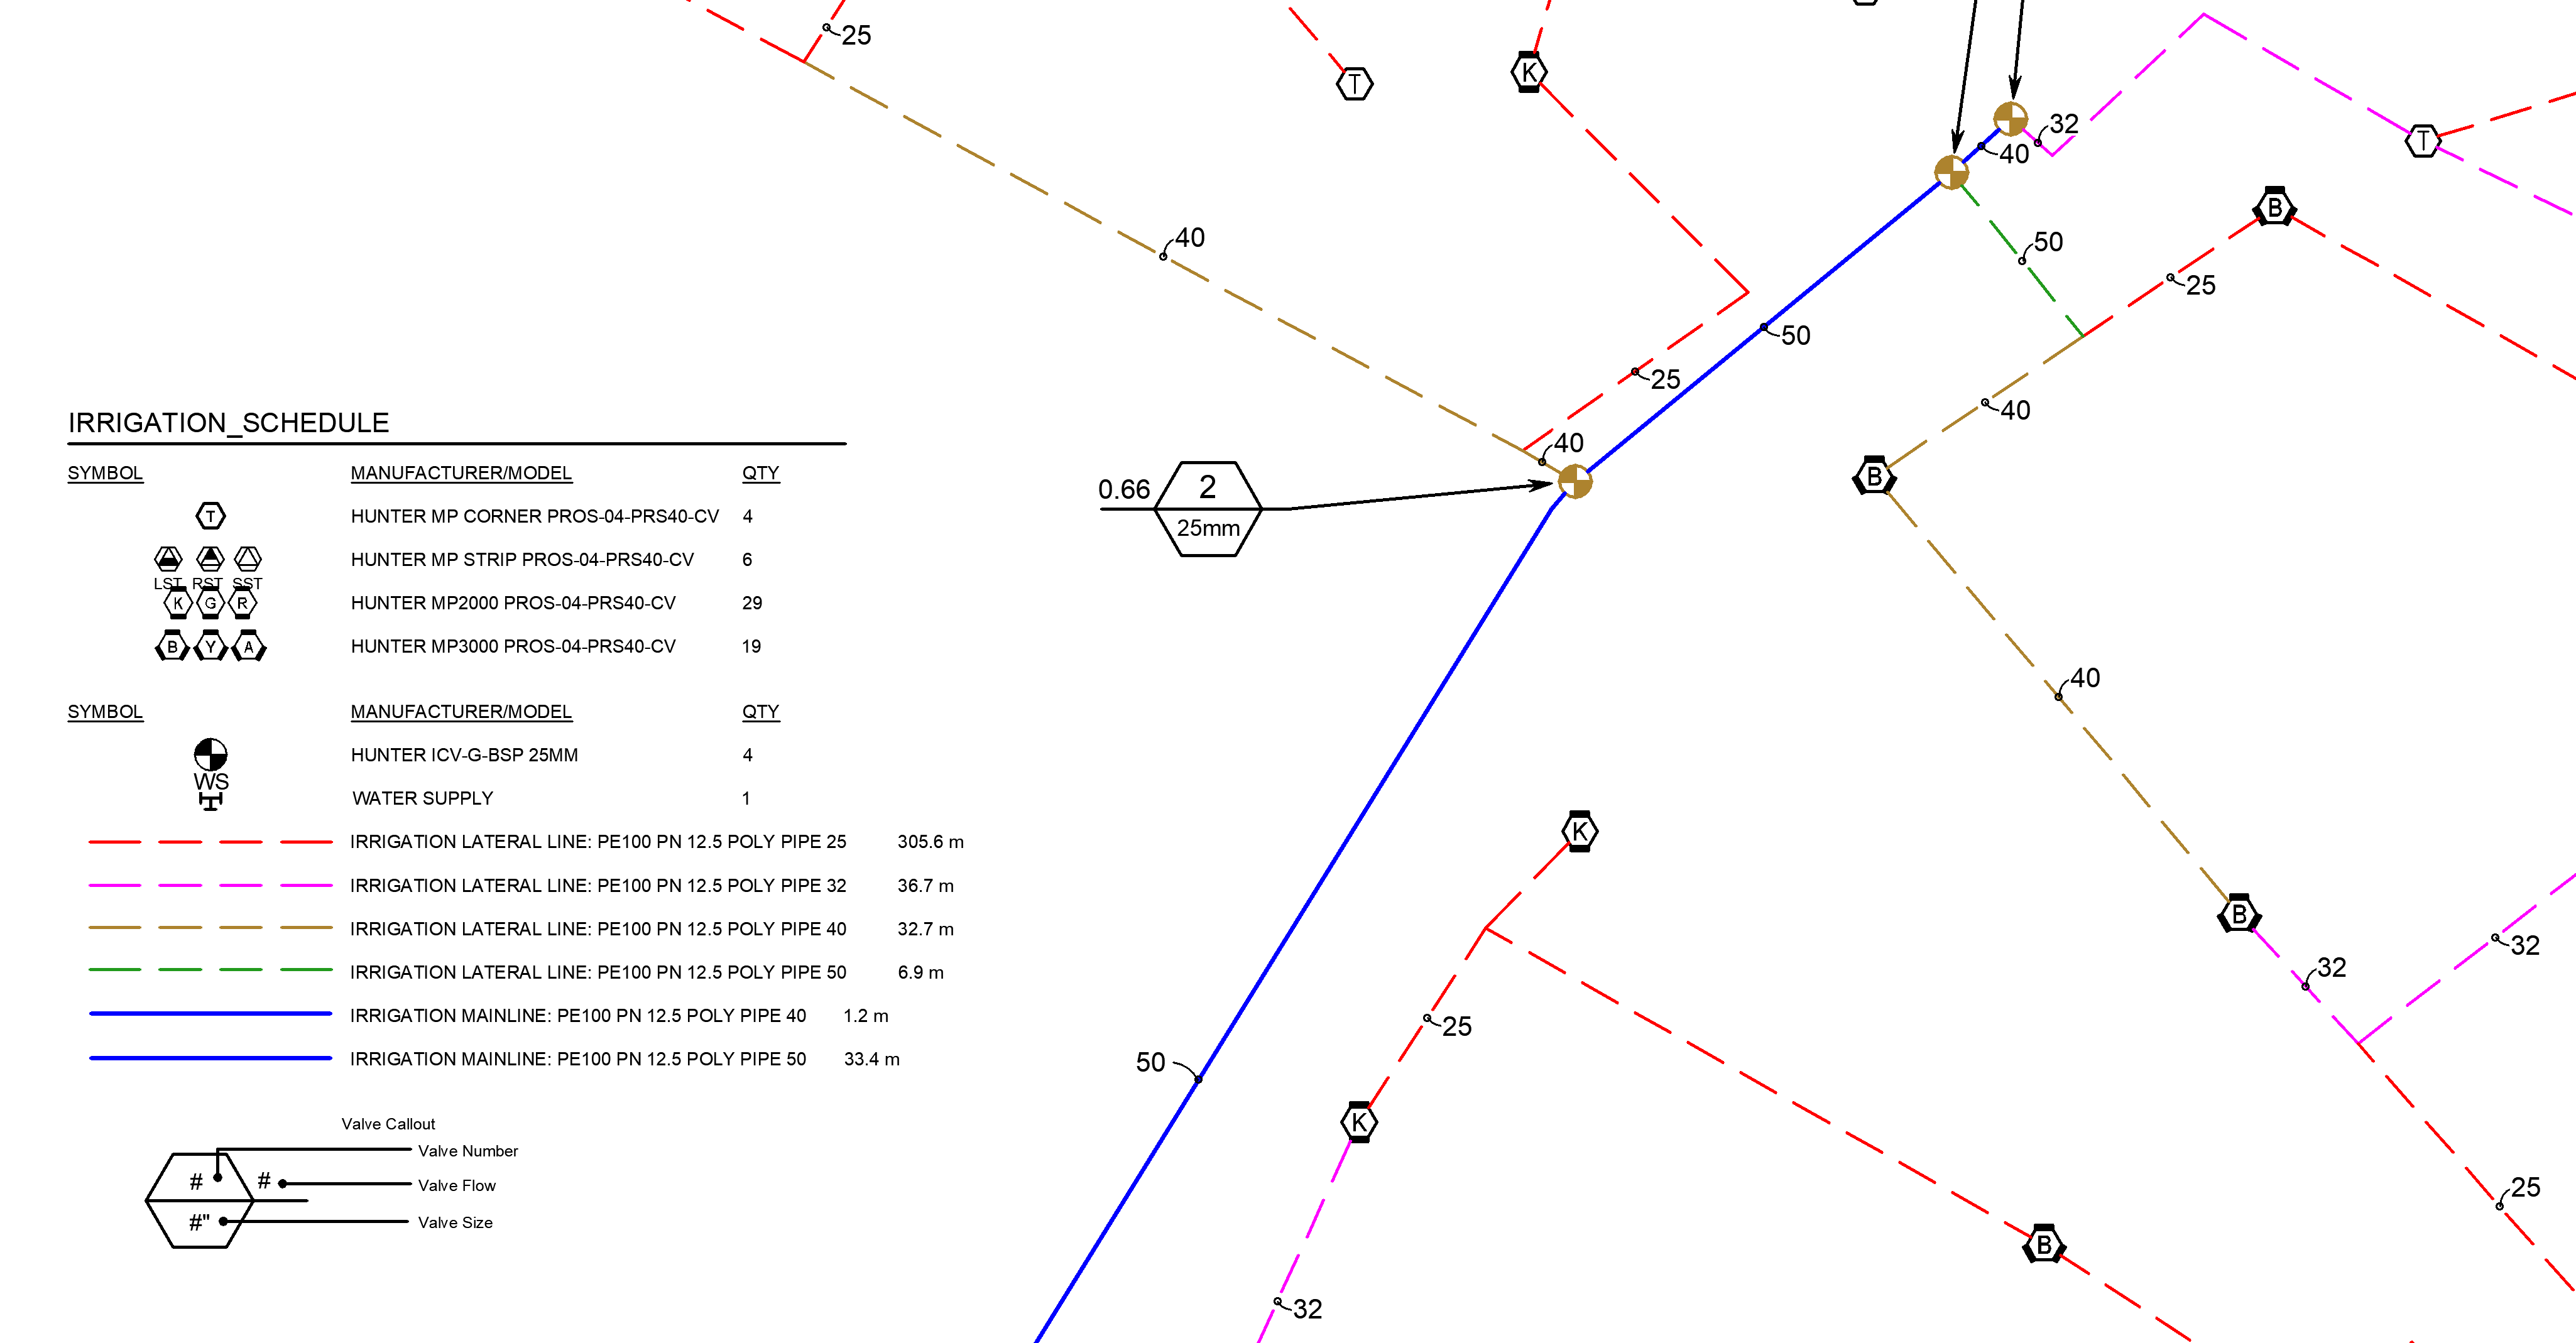
Several users have expressed a desire to plot their lateral and mainline pipe sizes in color, as well as show those pipe colors in the Irrigation Schedule. Read on for steps on how to do that.
To be able to plot your pipes in color and show their size colors in the Irrigation Schedule, you'll need to:
- Have the Color code by size option enabled in the Irrigation Preferences screen (pictured to the right) for the current Preference Set, and
- Want to show the sizes in True Color when plotting

If you want a portion of the plan (such as the pipes) to plot as color, you'll just need to duplicate your existing CTB file and make your modifications to the colors used for each pipe size. Here's how:

1. Type PLOT in the Command line and press Enter to open the Plot dialog box.
Verify that you have the correct plot style active in the Plot style table (pen assignments) menu, then click the Edit button to the right of the menu.
2. Immediately click Save As... .
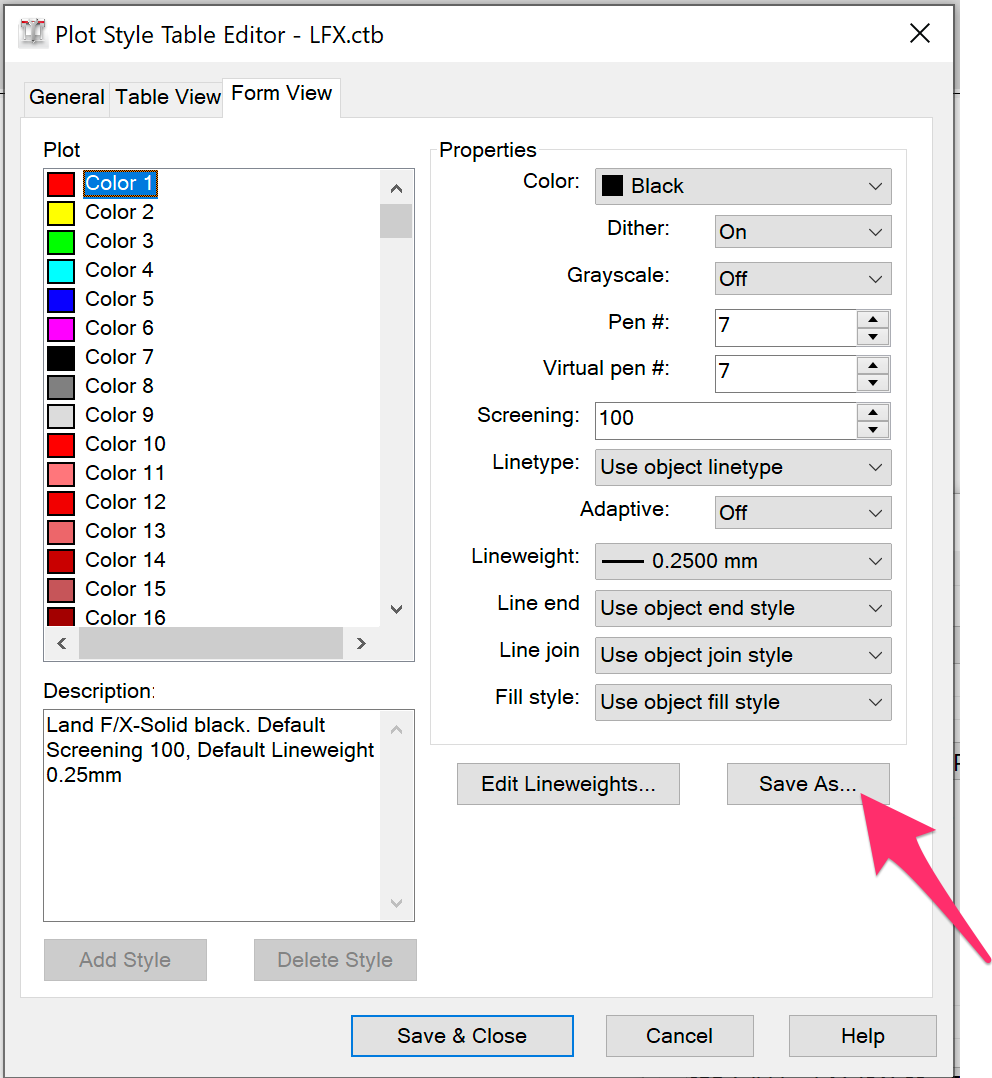

3. Give this new CTB file a name that will make it clear to other users how the CTB will function (example: LFX-ALL-PIPE-COLOR.ctb).
4. Back in the Plot Style Table Editor, select a pipe size line color in the Plot section and use the Color menu to change it to your desired color.
Repeat this step for each pipe size color you want to change.

Use the LFXPens color chart, pictured below, as a reference for which line color the system uses for each pipe size.


5. Click Save and close to save your changes to your CTB.
6. Make your new plot style active by selecting it from the Plot style table (pen assignments) menu.


7. Run a plot preview and confirm that your pipes are showing in your desired colors.
You can now easily change plot styles to plot in either black & white or color without the hassle of converting and changing layers within the drawing or Preference Set.
If you have a conflict between what Land F/X uses for pipe colors and your office standard colors, use our Block Layers tool to make these changes. From there, select the same color for each pipe layer you selected above.
Match the Pipe Blocks in the Irrigation Schedule to the Pipe Colors in the Drawing
To match the pipe blocks in the Irrigation Schedule to the pipe size colors in the drawing, you'll need to ensure your source pipe block files are set to Color ByBlock.
You have two options for achieving this step.

Option 1
Important: You should only use this option if you have not customized any of the source block files and are using Land F/X default styles. If you've made modifications to any of these blocks, use Option 2.

1. Open the folder LandFX\Blocks\Graphics\Irrigation\schedule_symbols and delete all files from that location whose names contain the characters pipe-lateral and pipe-main.
You may see several more pipe-lateral and pipe-main files in this location than pictured to the left. Take care to delete them all.
2. Delete and purge all existing irrigation schedules from your drawing.
To purge the deleted schedules, type PRG in the Command line and press Enter. This step will ensure that all existing schedule block definitions will be removed from your drawing.
3. Run a new Irrigation Schedule. The new pipe blocks will download on the fly, and you'll see the updated blocks.

Option 2
Only use this option if you have customized these source files.
1. Open the folder LandFX\Blocks\Graphics\Irrigation\schedule_symbols and open each DWG file in that location whose name contains the characters pipe-lateral and pipe-main.
You may see several more pipe-lateral and pipe-main DWG files in this location than pictured to the left.
2. Select all linework in the source DWG file by pressing the CTRL + A keys.
3. Type PROP in the Command line and press Enter to open the Properties panel.
4. Select the ByBlock option from the Color menu.

5. Save and close the file.
6. Delete and purge all existing irrigation schedules from your drawing.
To purge the deleted schedules, type PRG in the Command line and press Enter. This step will ensure that all existing schedule block definitions will be removed from your drawing.
7. Run a new schedule to see the updated blocks.
Plot Valves in Color to Show Their Sizes
You might also want to have your valves color coded in your plotted drawing to show their sizes, and have those colors to carry through to the schedule, as pictured below.
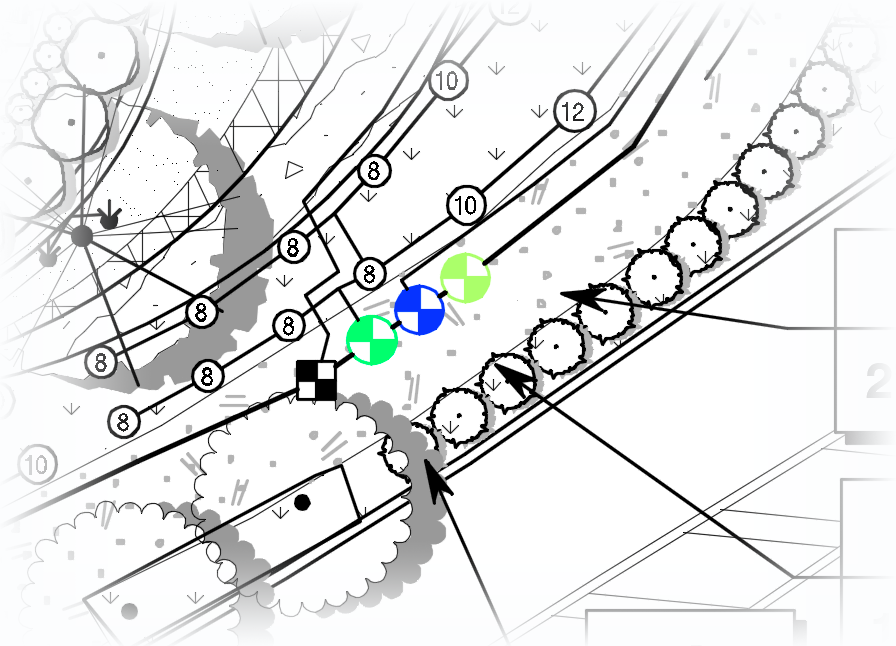
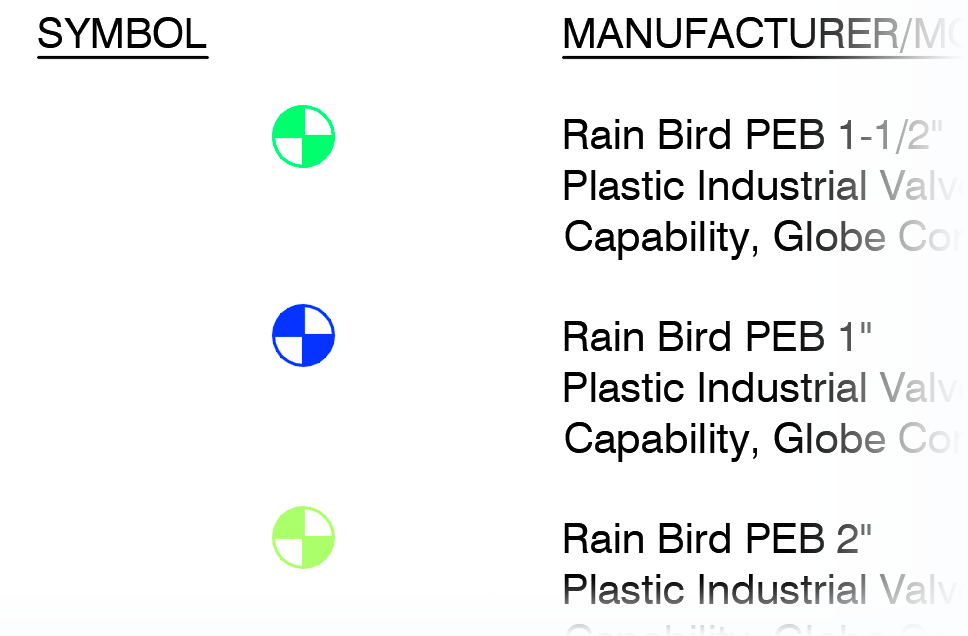
Here's how to plot your valves in color in both your drawing and your schedule:
Once you've placed all your valves, run an Irrigation Schedule.
Select the schedule, then type BEDIT in the Command line and pressing Enter to open the Block Editor.
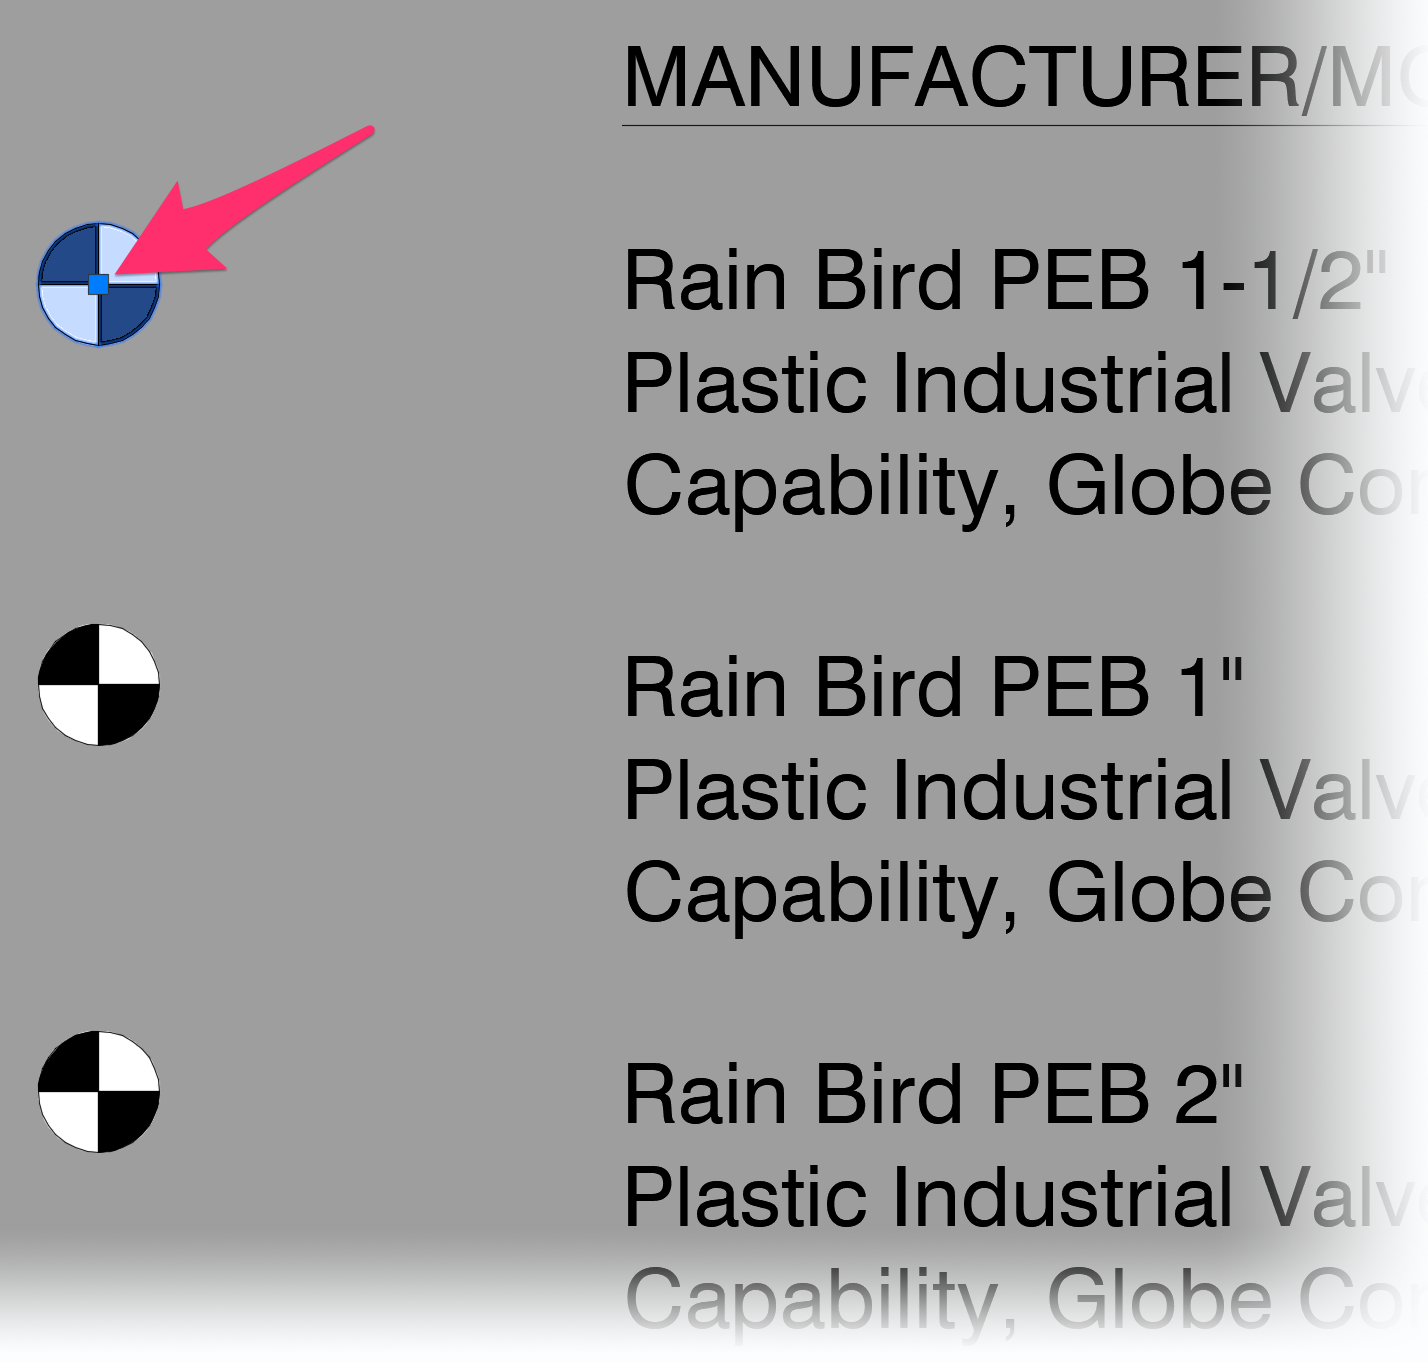
In the Block Editor, select one of the valve sizes.
Change the layer of that valve size to match the layer created by Land F/X when you change valves to that size in your drawing. The layer will have the prefix LI-IRRG-VALV-V, followed by a number representing that valve size.
In this example, we've moved the selected valve size to the layer LI-IRRG-VALV-V100.
Valve block layers are set to Layer 0, so when you change a valve’s size, Land F/X automatically sets it to one of these LI-IRRG-VALV-V- layers so you can see its color. Placing a valve schedule symbol on the layer that matches its size will allow it to plot in color.


Still in the Block Editor, select each of the additional valve sizes in the schedule, and change their layers to the correct size layers as well.
The valves in your schedule will now all be on the correct layers for their colors and sizes in the drawing.
Close the Block Editor, and save your changes.

Now move to your Layer Properties Manager. You can open it by typing LAYER in the Command line and pressing Enter.
Locate each valve size layer, and set each layer's color to the True Color tab and click OK. It will match the existing index color, but you'll still need to convert it to a True Color.

From here, you should be able to plot and everything will be black and white except the valves.
The modifications you make to a schedule to show valves in color are for that particular schedule. You will need to repeat these steps if you generate another schedule or regenerate the schedule you previously modified to show color. Our suggestion is to hold off on making these modifications until you're ready to plot, so you just have to make the change to the valve colors that one time.
CTB Plotting Styles
When plotting any drawing, make sure you're using a CTB (color-based) plot style. It's simply the easiest and most effective way to plot from CAD. You can use our default CTB or create your own. Read more about: